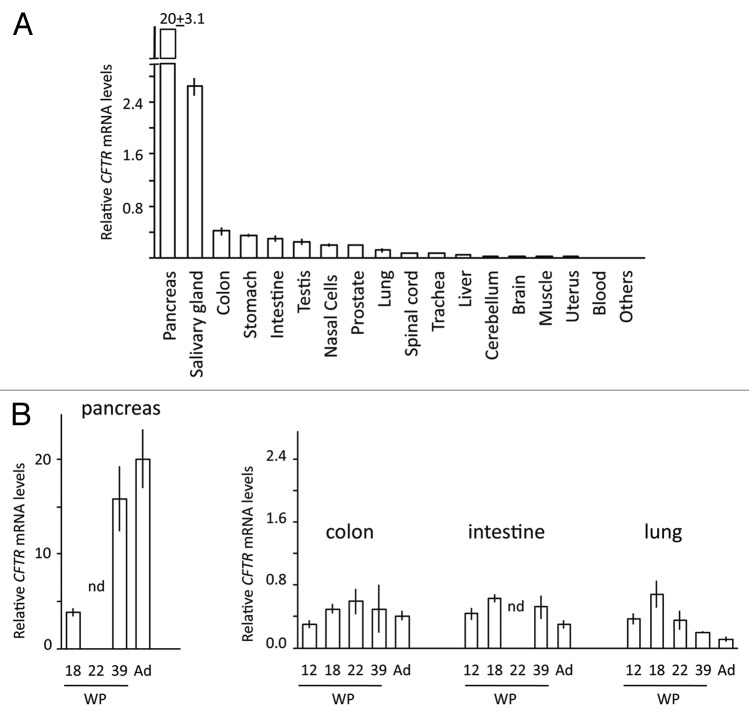
Figure 1. Relative expression of CFTR gene: the obtained values were normalized to the expression (considered equal to 1) of CFTR in the colon cancer cell line T84. (A) Adult tissues (mRNA pools comprising 1 to 64 different individuals); “Others” are tissues (heart, thymus, spleen, and bone marrow) whose expression was < 0.01. (B) Fetal tissues (mRNA from single individuals): WP, weeks of pregnancy; Ad, adult tissues (same data as in top figure); nd, not determined.

An official website of the United States government
Here's how you know
Official websites use .gov
A
.gov website belongs to an official
government organization in the United States.
Secure .gov websites use HTTPS
A lock (
) or https:// means you've safely
connected to the .gov website. Share sensitive
information only on official, secure websites.
