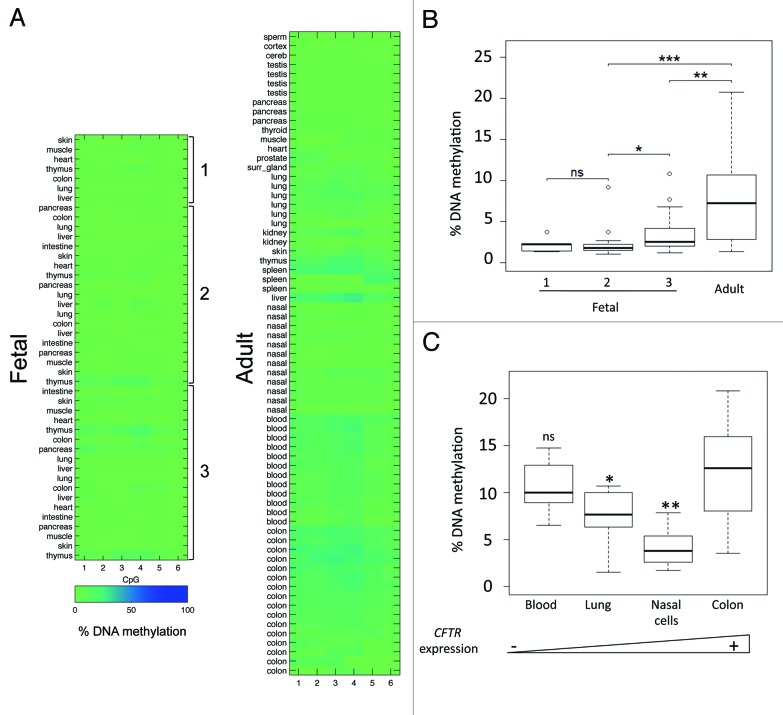
Figure 3. (A) Heat maps represent DNA methylation of the CFTR promoter in normal fetal and adult tissues (1, first; 2, second; 3, third trimester of pregnancy). Rows represent individual samples and columns the percentage of DNA methylation measured by pyrosequencing in 6 CpG within the promoter of CFTR. (B) Boxplots show DNA methylation distribution in fetal and adult tissues. Asterisks indicate statistical significance in two-by-two comparisons (*P = 9 × 10⁻³; **P = 7.4 × 10⁻⁷, ***P = 1.2 × 10⁻¹², “ns” is not significant (P = 0.75). (C) Boxplots represent inter-individual DNA methylation variations in blood (n = 12), lung (n = 6), nasal cell (n = 12) and colon (n = 16) samples. In two-by-two comparisons with colon samples, ns P = 0.547; *P = 0.011; **P = 2.04 10−7. The triangle at the bottom represents (from left to right) increasing levels of CFTR expression in the tissues.

An official website of the United States government
Here's how you know
Official websites use .gov
A
.gov website belongs to an official
government organization in the United States.
Secure .gov websites use HTTPS
A lock (
) or https:// means you've safely
connected to the .gov website. Share sensitive
information only on official, secure websites.
