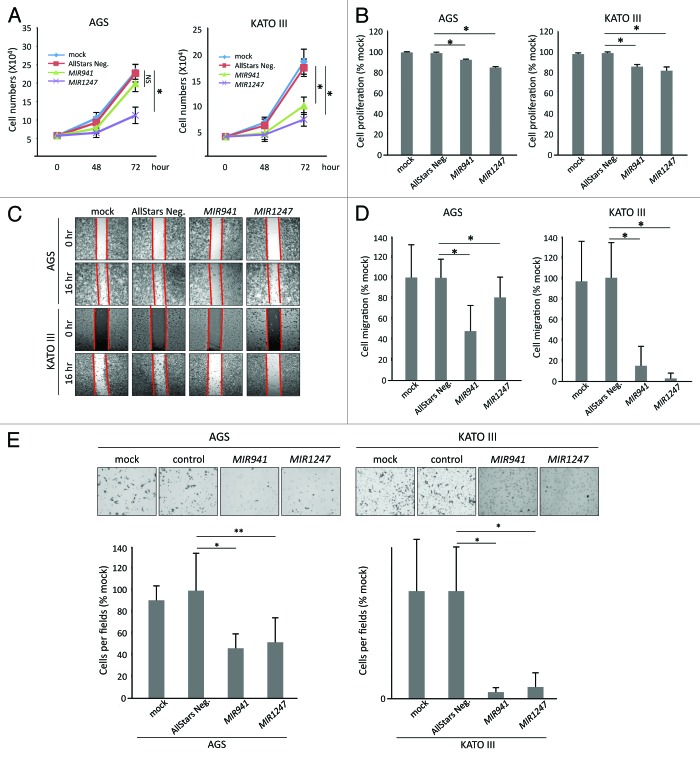
Figure 4. Functional analyses of MIR941 and MIR1247 in AGS and KATO III cells. (A) Growth curves and (B) MTT assays of AGS mock treated cells and AGS cells transfected with non-targeting negative control miRNA (All Star neg.), MIR941, or MIR1247 mimics. (C) Wound healing assay for AGS cells transfected with mock, non-targeting negative controls miRNA (All Star neg.), MIR941, or MIR1247 mimics. Photographs were taken at 16 h later after wounding. (D) The bar graph represents the quantity of migrated cells using transwell migration assay with AGS cells transfected with mock, non-targeting negative controls miRNA (All Star neg.), MIR941, or MIR1247 mimics. Quantity of migrated cells represents the mean of 3 random microscopic fields per membrane and error bars represent the SDs. (E) Transwell invasion assay using AGS cells transfected with mock, non-targeting negative controls miRNA (All Star neg.), MIR941, or MIR1247 mimics. Representative field of invasive cells on the membrane are shown. The Bar graph represents the mean of 3 random microscopic fields per membrane and error bars represent the SDs.

An official website of the United States government
Here's how you know
Official websites use .gov
A
.gov website belongs to an official
government organization in the United States.
Secure .gov websites use HTTPS
A lock (
) or https:// means you've safely
connected to the .gov website. Share sensitive
information only on official, secure websites.
