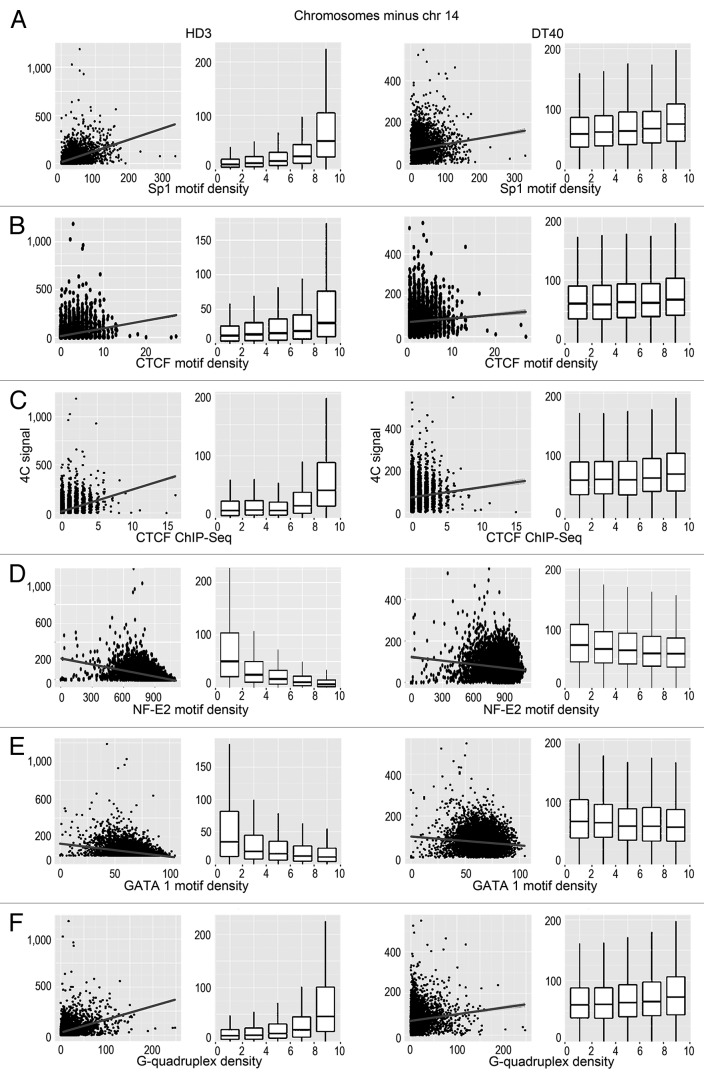
Figure 4. Scatterplots and box-plots showing the relationship between the NPRL3-4C signal (y-axis) in HD3 and DT40 cells and the density of various genomic features (x-axis). (A–F) The correlation of the NPRL3–4C signal with the Sp1 motifs, CTCF motifs, CTCF deposition sites, as determined by ChIP-Seq, NF-E2 binding motifs, GATA1 binding motifs, and G-quadruplex motifs is shown. Other designations are as in Figure 3.

An official website of the United States government
Here's how you know
Official websites use .gov
A
.gov website belongs to an official
government organization in the United States.
Secure .gov websites use HTTPS
A lock (
) or https:// means you've safely
connected to the .gov website. Share sensitive
information only on official, secure websites.
