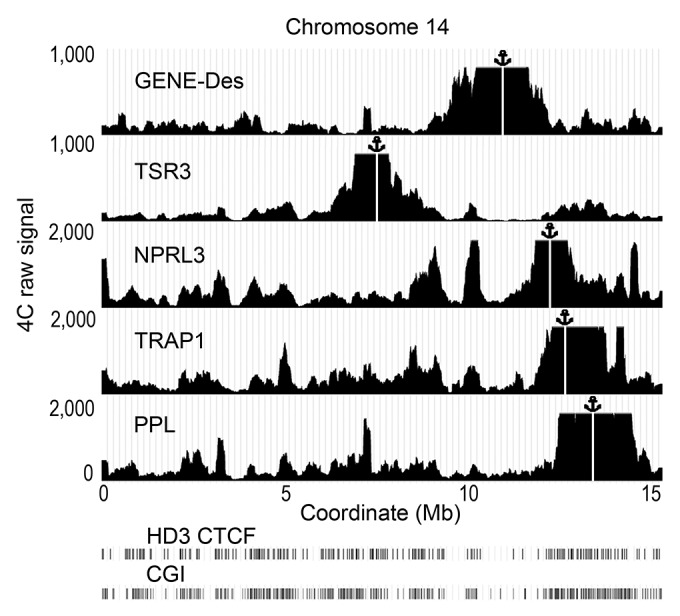
Figure 6. Distribution of the raw 4C signals on chromosome 14 obtained using the anchors situated in CGIs (NPRL3, TSR3, TRAP, PPL) and an anchor situated in a CGI-poor area (GENE-Des) in HD3 cells. The sequenced reads were aligned to the genome near HindIII sites. The distances along chromosome 14 are presented in Mb according to the galGal4 assembly (UCSC). The position of the viewpoint is indicated by the anchor sign above the graphs and by the vertical white line. The positions of CGIs and the CTCF deposition sites mapped by ChIP-Seq in HD3 cells are shown below the graphs demonstrating the distribution of the 4C signals (see the Fig. 1 legend for details). Note that in this illustration, the raw 4С signal was smoothed with moving average approach (200 Kb sliding window width).
