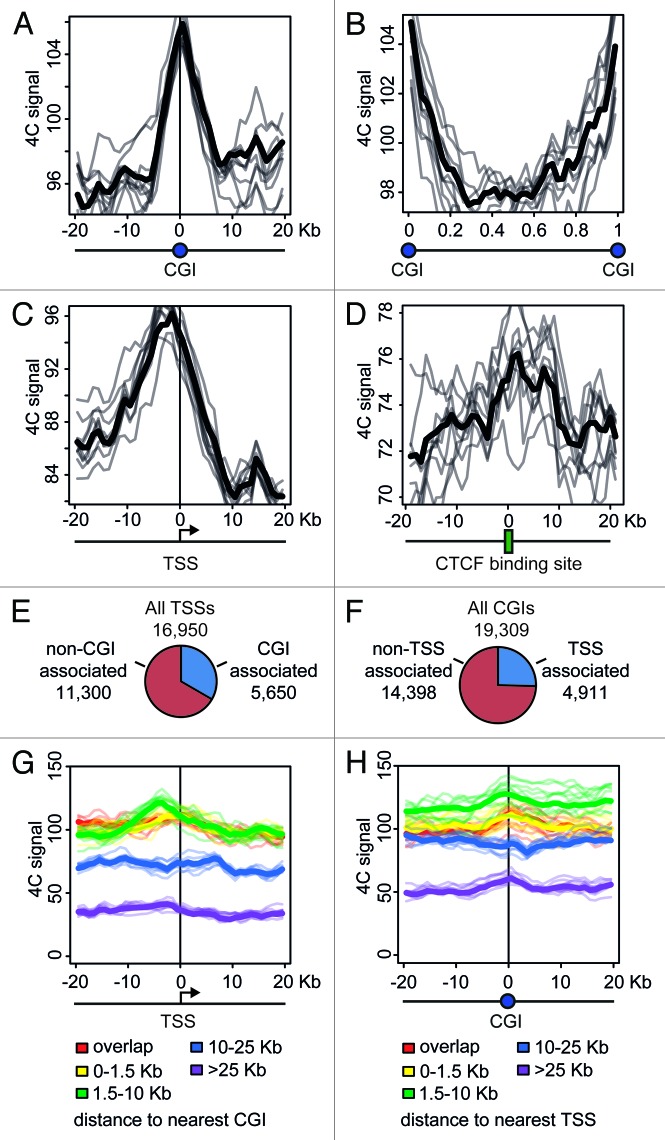
Figure 7. Distribution of the 4C signal in the vicinity of promoters and CGIs observed in experiments with NPRL3 anchor. (A, C, and D) Averaged 4C signal profiles for 40 consecutive 1 Kb bins surrounding various genomic features: CGIs (A), TSSs (С) or CTCF sites (D). Х-axis represent genomic coordinate relative to a genomic feature, y-axis represents averaged 4C signal value, gray lines represent the profiles for bootstrapped sets of genomic features (see Material and Methods section for details). (B) Averaged 4C signal profiles between consecutive CGIs. Х-axis represents relative location in a region between CGIs. (E) Fraction of TSSs overlapped by a CGI and (F) fraction of CGIs overlapping a TSS. (G, H) Plots similar to (A–D), showing averaged 4C signals in the vicinity of TSSs grouped by the distance of a TSS to the nearest CGI (G) and in the vicinity of CGIs grouped by the distance of a CGI to the nearest TSS (H). See the legend below the plots for the distances thresholds.

An official website of the United States government
Here's how you know
Official websites use .gov
A
.gov website belongs to an official
government organization in the United States.
Secure .gov websites use HTTPS
A lock (
) or https:// means you've safely
connected to the .gov website. Share sensitive
information only on official, secure websites.
