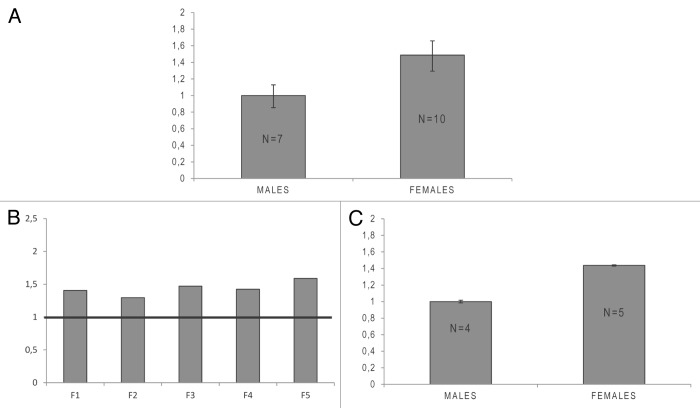
Figure 1.SMC1A expression in healthy males and females. (A) Graphical representation of real-time PCR analysis of SMC1A transcript levels in seven males and ten females. Histograms show the average expression level of the gene in the two groups. Male and female data were compared using a one-tailed Mann-Whitney U test (***P = 0.0001). Expression data were normalized to RPLP0, and relative mRNA levels were determined using the ΔΔCt method. Data are expressed as mean ± standard deviation. (B and C) SMC1A protein expression in healthy male and females obtained through semi-quantitative immunoblotting. (B) Histograms show the relative expression of the SMC1A protein in the five female controls (F) compared with the average expression level in the four male controls (set as 1 and represented by a horizontal black line). (C) Average expression of SMC1A protein in four males and five females. Male and female data were compared using a one-tailed Mann-Whitney U test (**P = 0.0079). Expression data were normalized to GAPDH. Data are expressed as mean ± standard deviation.

An official website of the United States government
Here's how you know
Official websites use .gov
A
.gov website belongs to an official
government organization in the United States.
Secure .gov websites use HTTPS
A lock (
) or https:// means you've safely
connected to the .gov website. Share sensitive
information only on official, secure websites.
