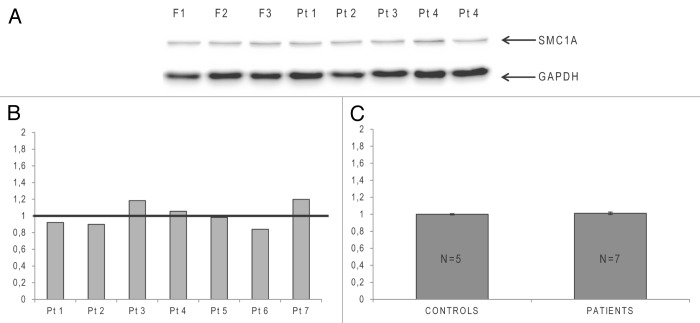
Figure 2. Semi-quantitative immunoblotting analysis of SMC1A in Cornelia de Lange syndrome (CdLS) X-linked patients and female controls. (A)Representative immunoblot performed on lymphoblastoid cell lines (LCLs) of three controls (F) and five CdLS SMC1A-mutated patients. The upper band represents the ~150 kDa SMC1A protein, and the lower migrating band represents the ~36 kDa GAPDH protein, which was used for normalization. (B) Histograms showing relative expression of the SMC1A protein in the mutated CdLS female patients (Pt) compared with the average expression level in five female controls (set as 1 and represented by a horizontal black line). (C) Graphical representation of the average SMC1A protein expression level in a group of five female controls and seven CdLS patients. Data were compared using a one-tailed Mann-Whitney U test (P = 0.5).

An official website of the United States government
Here's how you know
Official websites use .gov
A
.gov website belongs to an official
government organization in the United States.
Secure .gov websites use HTTPS
A lock (
) or https:// means you've safely
connected to the .gov website. Share sensitive
information only on official, secure websites.
