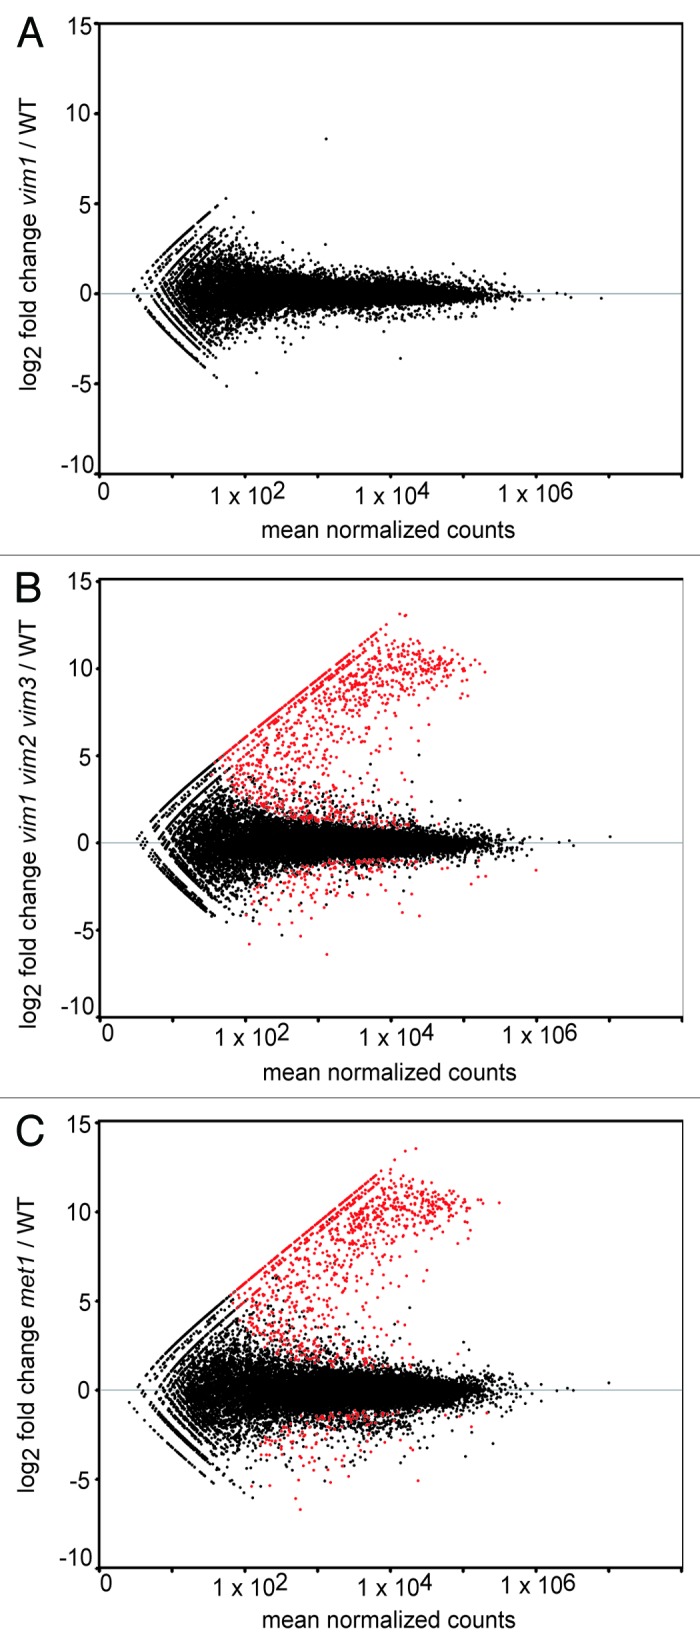
Figure 1.Identification of differentially expressed transcripts in vim1 vim2 vim3 and met1 mutants. MA-plots of log2 fold change transcript expression vs. mean normalized counts in vim1 (A), vim1 vim2 vim3 (B) and met1 (C) mutants relative to wild type. Red points represent differentially expressed transcripts meeting the adjusted P value cut-off of 0.05 or lower. Black points represent all other transcripts not called differentially expressed. Notably, no transcripts, other than VIM1, were identified as differentially expressed in the vim1 mutant, while over 2000 transcripts were differentially expressed in vim1 vim2 vim3 and met1 relative to wild type. The majority of the red points fall above the gray horizontal line at zero, indicating that most differentially expressed genes are upregulated in the vim1 vim2 vim3 and met1 mutants.
