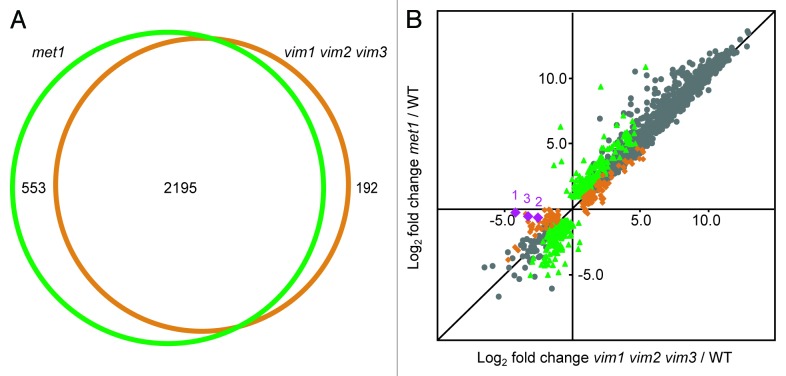
Figure 2. VIM proteins and MET1 regulate extensively overlapping sets of transcripts. (A) Venn diagram illustrating the large overlap between the targets differentially expressed in met1 mutants (green circle) and the targets differentially expressed in vim1 vim2 vim3 mutants (orange circle). Numbers of targets specific to each mutant and shared between the two mutants are indicated. (B) Scatter plot showing high correlation between the log2 fold change expression values in met1 relative to wild type (y-axis) and vim1 vim2 vim3 relative to wild type (x-axis). Green data points represent transcripts differentially expressed only in met1; orange data points correspond to transcripts differentially expressed only in vim1 vim2 vim3; and gray data points represent transcripts differentially expressed in both mutants relative to wild type. As a confirmation of the vim1 vim2 vim3 mutant genotype, the VIM1, VIM2, and VIM3 transcripts are represented with purple diamonds labeled 1, 2, and 3, respectively. Transcripts with an expression value of zero in the mutant or wild type sample were excluded from this analysis. A black line representing y = x is shown for reference.

An official website of the United States government
Here's how you know
Official websites use .gov
A
.gov website belongs to an official
government organization in the United States.
Secure .gov websites use HTTPS
A lock (
) or https:// means you've safely
connected to the .gov website. Share sensitive
information only on official, secure websites.
