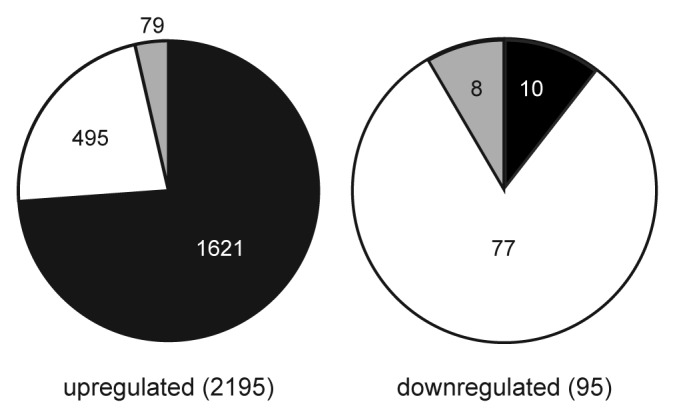
Figure 4. Comparison of upregulated and downregulated targets differentially expressed in vim1 vim2 vim3 and met1 mutants. Pie charts show the proportions of transposable elements (black), protein-coding genes (white) and other transcripts such as microRNAs or unclassified RNAs (gray) among the genes upregulated (left) and downregulated (right) in both vim1 vim2 vim3 and met1 mutants. Transposable elements are highly represented in the upregulated set, while most of the downregulated genes are protein-coding. Numbers of targets in each category are indicated on the pie charts, with total numbers of targets in the upregulated and downregulated sets indicated in parentheses.
