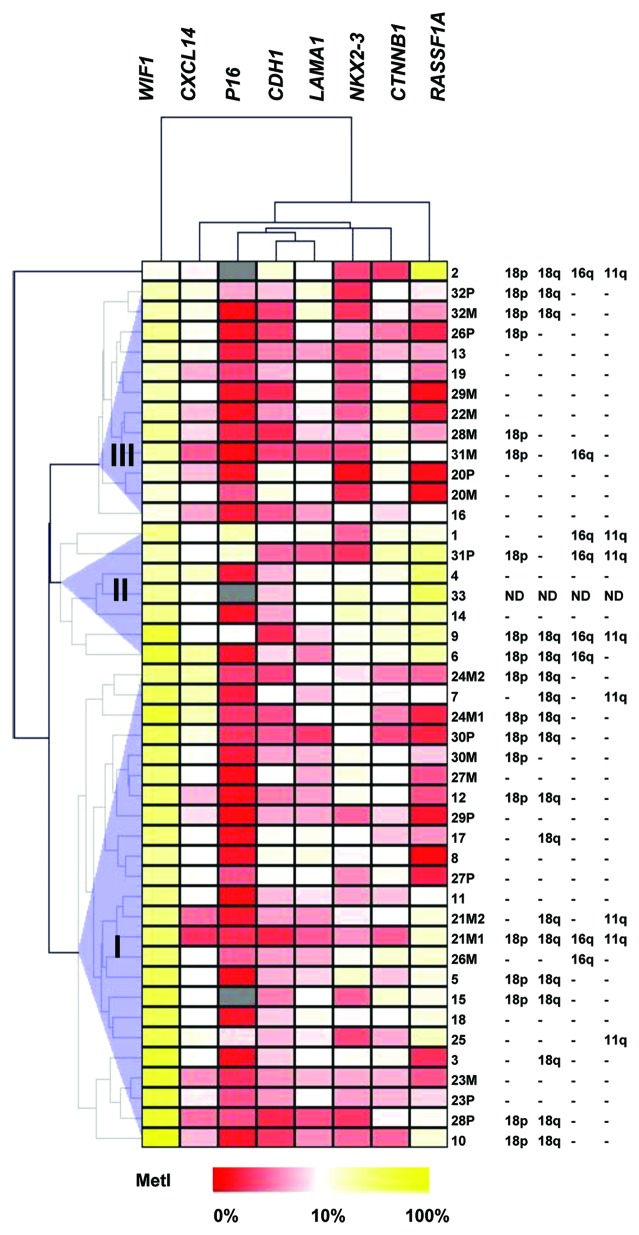
Figure 2. Unsupervised hierarchical clustering of Pyrosequencing data for genes that were found methylated in SI-NETs. MetI values of 0–100% were converted to a range of 0 to 1 and subjected to Euclidean hierarchical clustering. The three tumor clusters are indicated as I, II and III. Gray indicates lack of data. Previously published15 data for copy number loss determined by qPCR for loci representing 11q (SDHD), 16q (CDH1), 18p (EMILIN2) and 18q (CDH19) in case 1–32 are indicated to the right for comparison.

An official website of the United States government
Here's how you know
Official websites use .gov
A
.gov website belongs to an official
government organization in the United States.
Secure .gov websites use HTTPS
A lock (
) or https:// means you've safely
connected to the .gov website. Share sensitive
information only on official, secure websites.
