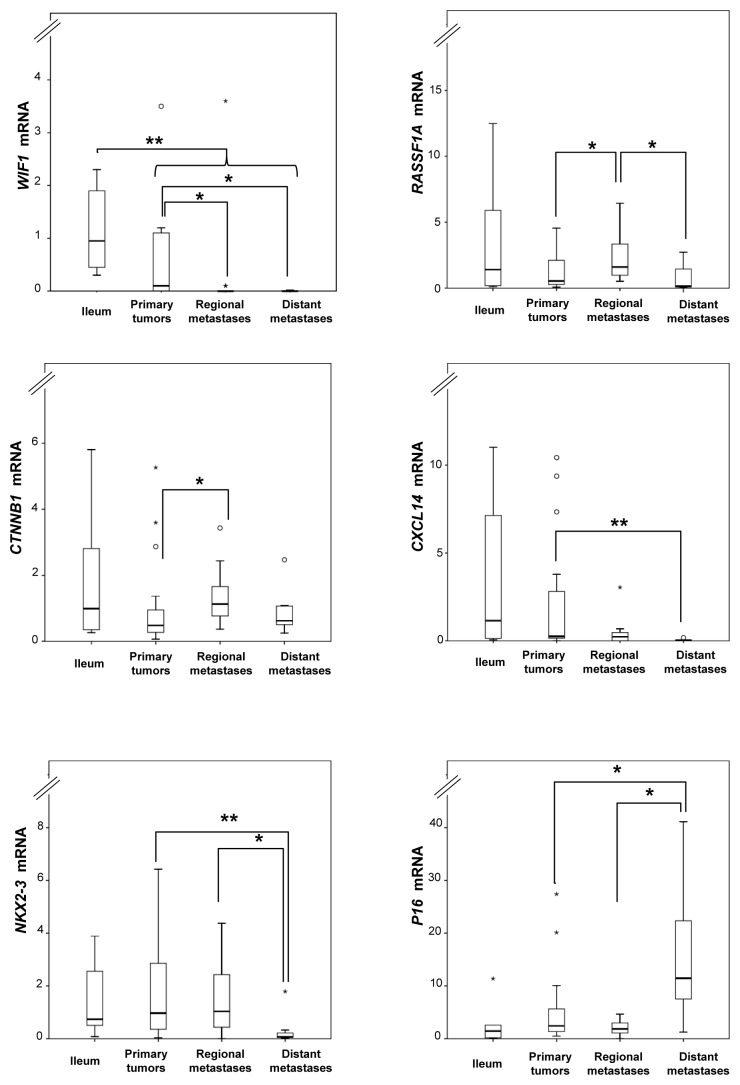
Figure 3. Relative mRNA expression levels determined by qRT-PCR for selected loci in normal ileum references and tumor subgroups. Fold changes are represented as compared with the mean of ileum (assigned the arbitrary value of 1). P values for statistical comparisons between groups are indicated for suggestive P values ≤ 0.050 (*) or ≤ 0.01 (**).

An official website of the United States government
Here's how you know
Official websites use .gov
A
.gov website belongs to an official
government organization in the United States.
Secure .gov websites use HTTPS
A lock (
) or https:// means you've safely
connected to the .gov website. Share sensitive
information only on official, secure websites.
