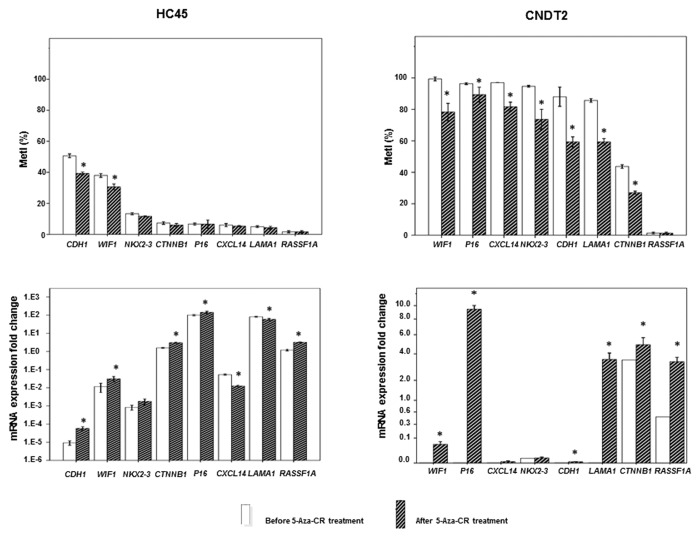
Figure 5. Promoter methylation and gene expression in SI-NET cell lines treated by 5µM 5-aza-CR. At the top is shown MetI in HC45 and CNDT2 cell lines treated with 5-aza-CR. Corresponding mRNA expression fold changes are shown below. The values are in relation to SI-NET 30P in which all genes were expressed (assigned the arbitrary value 1.0). Results before and after 5-aza-CR treatments are indicated by white and striped bars, respectively. P values for statistical comparisons between groups are indicated for suggestive P values ≤ 0.050 (*).

An official website of the United States government
Here's how you know
Official websites use .gov
A
.gov website belongs to an official
government organization in the United States.
Secure .gov websites use HTTPS
A lock (
) or https:// means you've safely
connected to the .gov website. Share sensitive
information only on official, secure websites.
