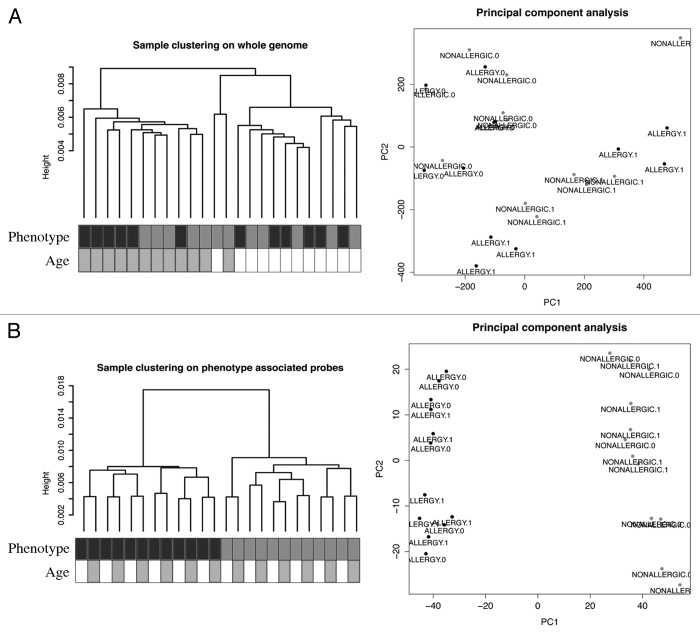
Figure 1. A subset of DNA methylation profiles of CD4+ cells distinguishes food allergy cases from controls. (A) Unsupervised hierarchical clustering of whole genome methylation data derived from ex vivo isolated CD4+ cells of food allergy cases (n = 12, labeled black) and non-allergic controls (n = 12, labeled gray) (left panel). Sample annotation is indicated by shaded boxes below the dendrogram. MDS analysis of the same methylation data fails to discriminate samples based on disease-status (right panel). (B) Unsupervised clustering of the same DNA methylation data based on phenotype-associated probes identified by ANOVA distinguishes disease-phenotypes (left panel). MDS analysis based on the filtered data successfully discriminates food allergy cases and controls. ALLERGY.1 = allergic 12 min, ALLERGY.0 = allergic birth.

An official website of the United States government
Here's how you know
Official websites use .gov
A
.gov website belongs to an official
government organization in the United States.
Secure .gov websites use HTTPS
A lock (
) or https:// means you've safely
connected to the .gov website. Share sensitive
information only on official, secure websites.
