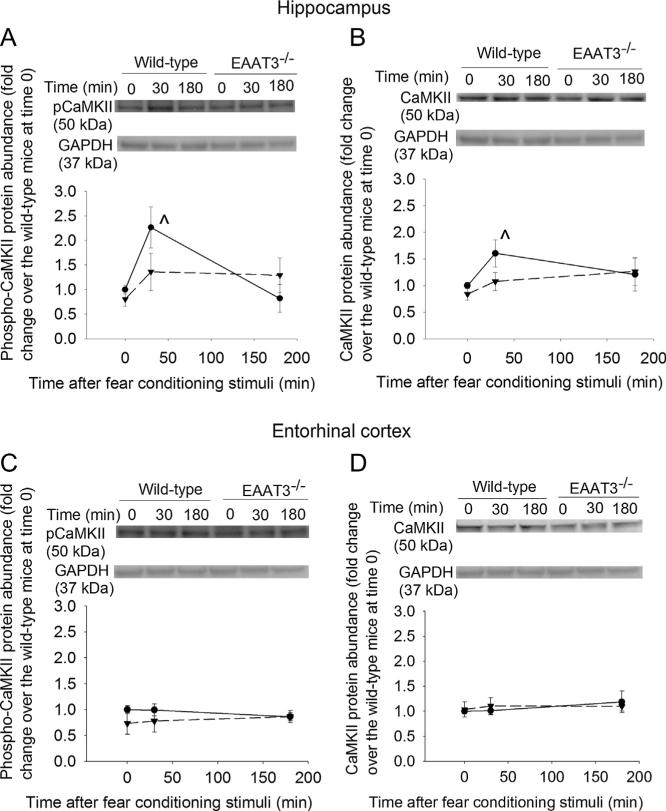
Fig. 7.
Expression of the calcium–calmodulin-dependent protein kinase II (CaMKII) in the CA1 region and entorhinal cortex. Seven- to nine-week old CD-1 wild-type or EAAT3 knockout mice were subjected to the fear conditioning stimuli. Their CA1 regions (panels A and B) and entorhinal cortices (panels C and D) were harvested before the stimuli, or 30 min or 180 min after the stimuli for Western blotting of phospho-CaMKII (panels A and C) and CaMKII (panels B and D). Total cellular protein was used for the assay. A representative Western blot is shown on the top of each panel and a graphic presentation of the CaMKII protein abundance quantified by integrating the volume of CaMKII autoradiogram bands from 8 to 16 mice for each experimental condition is shown in the bottom panel. Values in graphs are the means ± SEM. ^P < 0.05 compared with the corresponding value at time 0. EAAT3 −/− : glutamate transporter type 3 knockout.

