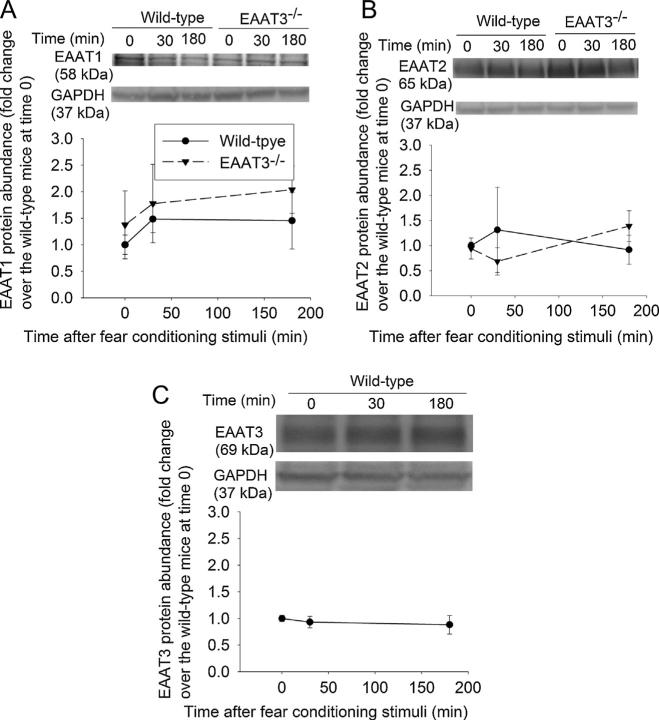
Fig. 9.
Expression of the glutamate transporters (EAATs) in the plasma membrane of the entorhinal cortex. Seven- to nine-week old CD-1 wild-type or EAAT3 knockout mice were subjected to the fear conditioning stimuli. Their entorhinal cortices were harvested before the stimuli, or 30 min or 180 min after the stimuli for Western blotting of EAAT1 (panel A), EAAT2 (panel B) and EAAT3 (panel C). A representative Western blot is shown on the top of each panel and a graphic presentation of the EAAT protein abundance quantified by integrating the volume of EAAT autoradiogram bands from 5 to 12 mice for each experimental condition is shown in the bottom of each panel. Values in graphs are the means ± SEM. EAAT3 −/− : glutamate transporter type 3 knockout.

