
Figure A1.
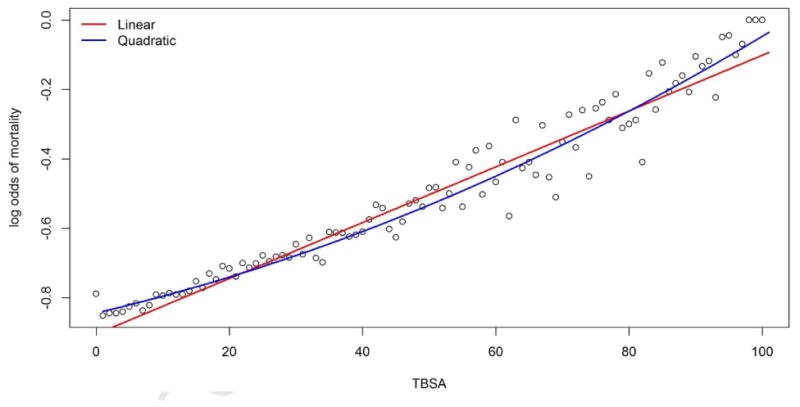
Log odds of mortality calculated for each 1% of total burn surface area using the training set consisting of 50,025 records. The red line shows a regression fit with a linear term for TBSA and the blue line shows the regression fit with a linear and quadratic term for TBSA.