
Figure A3.
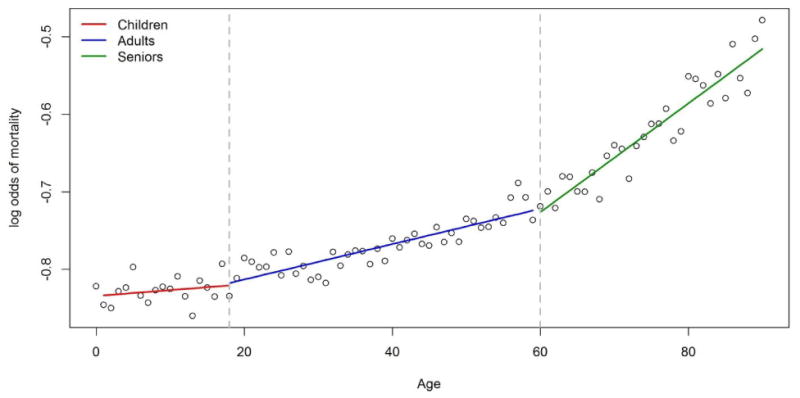
Log odds of mortality calculated for each 1 year of age using the training set consisting of 50,025 records. Solid lines show linear regression fitted values determined separately for children (red), adults (blue) and seniors (green).
Official websites use .gov
A
.gov website belongs to an official
government organization in the United States.
Secure .gov websites use HTTPS
A lock (
) or https:// means you've safely
connected to the .gov website. Share sensitive
information only on official, secure websites.
Log odds of mortality calculated for each 1 year of age using the training set consisting of 50,025 records. Solid lines show linear regression fitted values determined separately for children (red), adults (blue) and seniors (green).