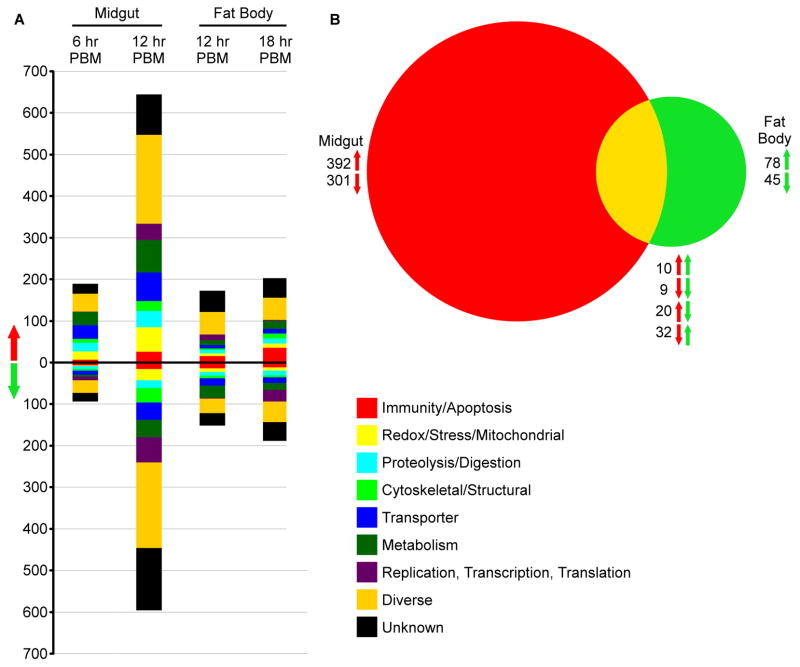
Figure 1. Global changes in transcript levels in transgenic A. stephensi following Rel2 induction.
A) The total number of genes significantly up- or down-regulated that are predicted to be in each GO category. Genes were considered significantly differentially regulated if the -fold change was>= 0.75 on a log2 scale. B) Venn diagram comparing the total number of regulated transcripts between the midgut of CP line mosquitoes and fat body of VG line mosquitoes at 12 h PBM. Red arrows correspond to midgut samples, and green arrows correspond to fat body samples; the arrow direction indicates significant up- or down-regulation.

