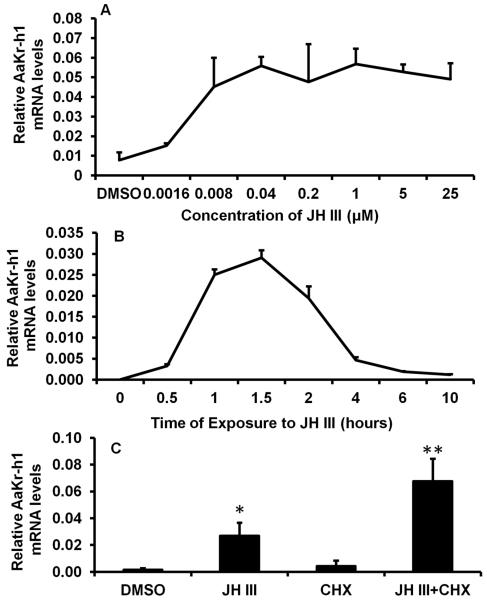
Fig. 1.
JH dose-response and time-course in induction of AaKr-h1 in Aag-2 cells. Aag-2 cells were exposed to different concentrations of JH III for 2 hr (A) or to 1 μM of JH III for different time periods (B) or to 1 μM of JH III and 10 μg/ml Cycloheximide (CHX) for 2 hr (C). Total RNA was isolated and used in qRT-PCR to quantify AaKr-h1 mRNA levels. AaS7RP mRNA levels measured in the same samples at the same time were used for normalization. Mean + S.E. (n=3) are shown. The data were analyzed using one-way ANOVA. **, significantly different at P<0.01; *, significantly different at P<0.05.

