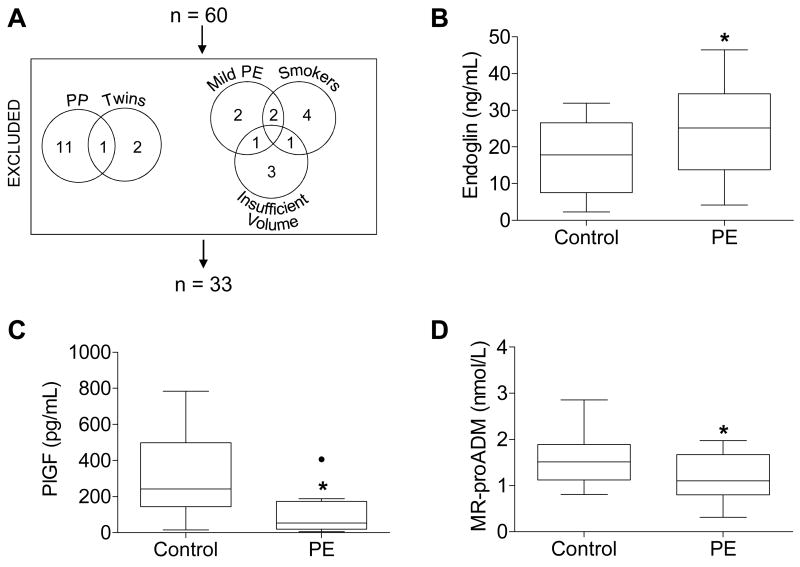
Figure 1.
(A) Patients excluded from the original 60 patient cohort and (B-D) plasma concentrations of (B) endoglin, (C) placental growth factor (PlGF), and (D) MR-proADM measured by ELISA (A, B) or sandwich immunoassay (C) in controls and women with severe preeclampsia (PE). Boxes extend from the 25th to the 75th percentile. Whiskers extend 1.5 times the interquartile range below and above the 25th and 75th percentiles, respectively. Horizontal lines dividing the boxes identify the median of each group. Significant outliers, determined by Grubbs' test, are identified by a solid black dot and excluded from the analysis in this figure. Four plasma samples were too concentrated to be detected within the range of the endoglin ELISA standard curve; one of these samples belonged to the control group, while the other three belonged to the PE group. Likewise, four plasma samples were too dilute to be detected within the range of the PlGF ELISA standard curve; all four of these samples belonged to the PE group. These too-concentrated or too-dilute samples were excluded from analysis. Groups were compared by Student's t-test. *p=0.046 (A) and 0.007 (B), and 0.041 (C). PP, postpartum.

