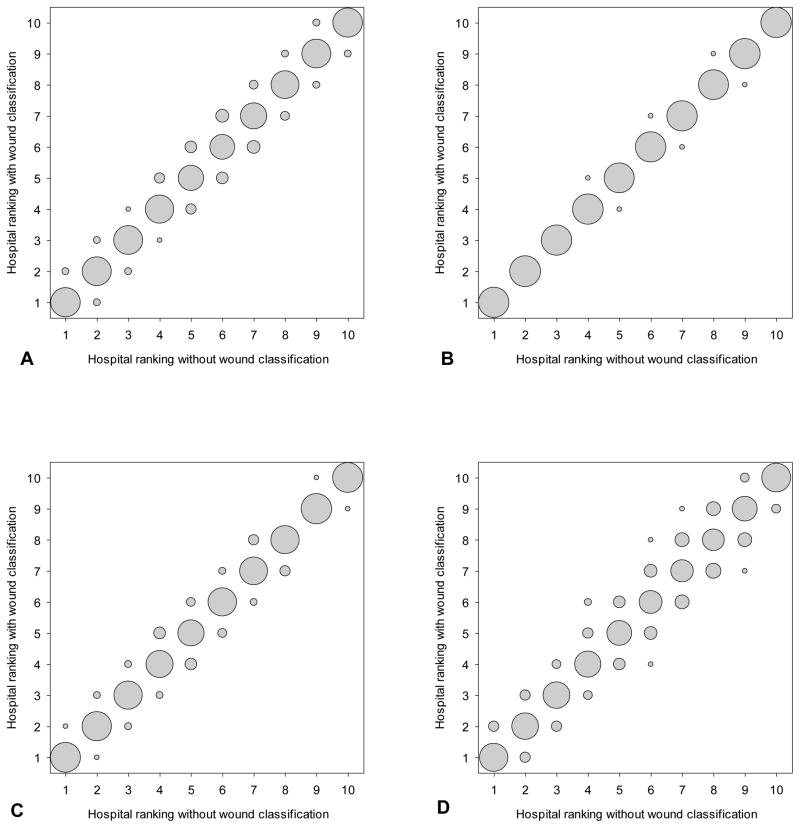
Figure 2.
Comparison in deciles for 315 hospitals in NSQIP (2011) using the model excluding wound classification and the model including wound classification for (A) any surgical site infection (SSI), (B) superficial incisional SSI, (C) deep incisional SSI, and (D) organ space SSI. Size of the bubbles represents proportion of hospitals: bigger bubble means more hospitals.

