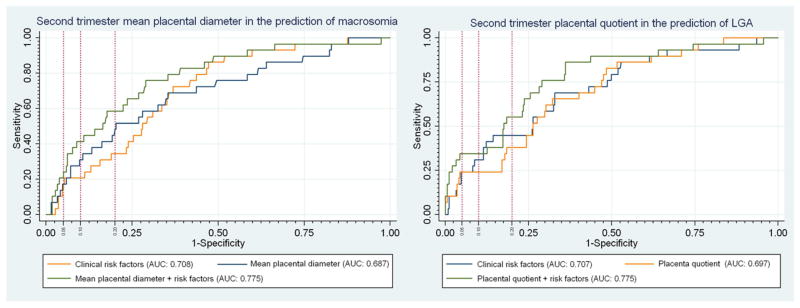
Figure 3.

ROC curves for second trimester placental quotient as a predictor of macrosomia and second trimester mean placental diameter (MPD) as a predictor of LGA. Vertical reference lines were placed to represent a false-positive rate of 5%, 10% and 20%. The corresponding sensitivity for the model can be seen by following the horizontal reference line to the y-axis.
