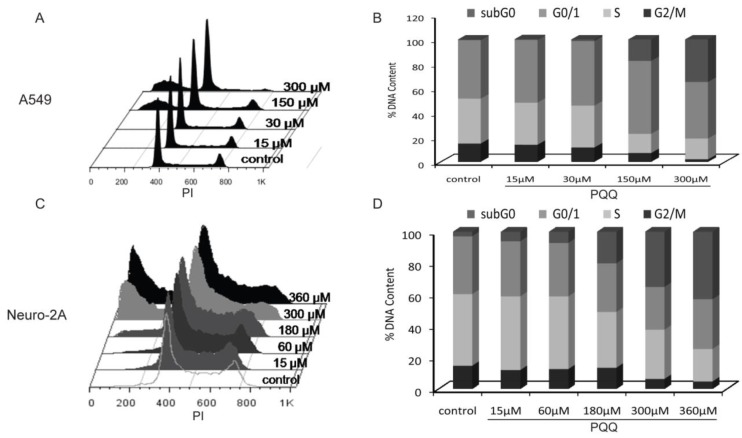
Figure 7.
Effects of PQQ on cell cycle regulation in A549 and Neuro-2A cells. Flow cytometry analysis of cell cycle distribution of A549 and Neuro-2A cells. The 2 cell lines were treated with PQQ at the indicated concentrations for 24h. Effects of PQQ on cell cycle were investigated using PI (Propidium Iodide) staining subjected to flow cytometry (panels A and C). The peaks from left to right represent sub-G0/G1 phase, G0/G1 phase, S phase and G2M phase respectively. Represent cells in different phases from three independent experiments (panels B and D).

