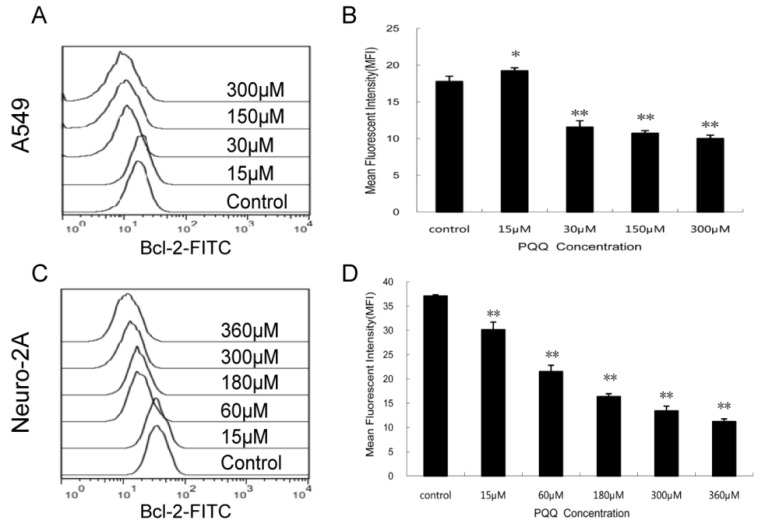
Figure 9.
Decreased expression of Bcl-2 by PQQ treatment. Effects of PQQ on Bcl-2 expression in A549 and Neuro-2A cells for 24h. Levels of the cytoplasmic Bcl-2 protein were quantitatively measured by flow cytometer and presented as mean fluorescent intensity (MFI). The overlay histograms (panels A and C) respectively indicated Bcl-2 expression at protein level of the 2 cell lines after treatment with various concentrations of PQQ for 24h. Bar diagram (panels B and D) represent MFI values from three-independent experiments as means ± SEM. *p < 0.05 as compared with control group; **p < 0.01 as compared with control group.

