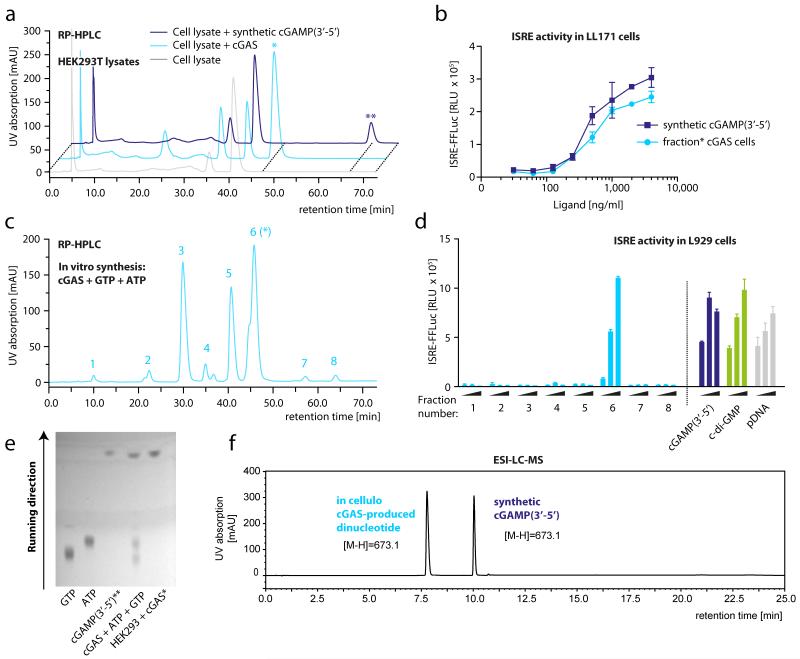
Figure 2. The cGAS reaction product is distinct from cGAMP(3′-5′).
a, RP-HPLC chromatograms of lysates of untreated HEK293T cells (grey), of cGAS overexpressing HEK293T cells (light blue) or of synthetic cGAMP(3′-5′) spiked into untreated HEK293T lysate (dark blue). Asterisks highlight differential elution peaks. b, IFN-stimulated response element (ISRE) activity in LL171 cells. Endogenous cGAS product was purified from a and transfected into LL171 cells, whereas synthetic cGAMP(3′-5′) served as a control. ISRE-reporter activity was measured 14 h later. c, Chromatogram of an in vitro cGAS assay. The asterisk indicates the fraction that elutes at the same retention time as the endogenous product from a. d, ISRE activity in LL171 cells. Peaks 1-8 from c were fractionated and transfected into LL171 cells that were then studied for ISRE-reporter activity using respective control stimuli. e, TLC analysis of in-vitro- and in-vivo-synthesized cGAS product with ATP, GTP and synthetic cGAMP(3′-5′) as controls. f, ESI-LC-MS analysis of in-vivo-produced cGAS product and synthetic cGAMP(3′-5′). Representative data of two (e) or three (a-d, f) independent experiments are shown (mean values + s.e.m.).

