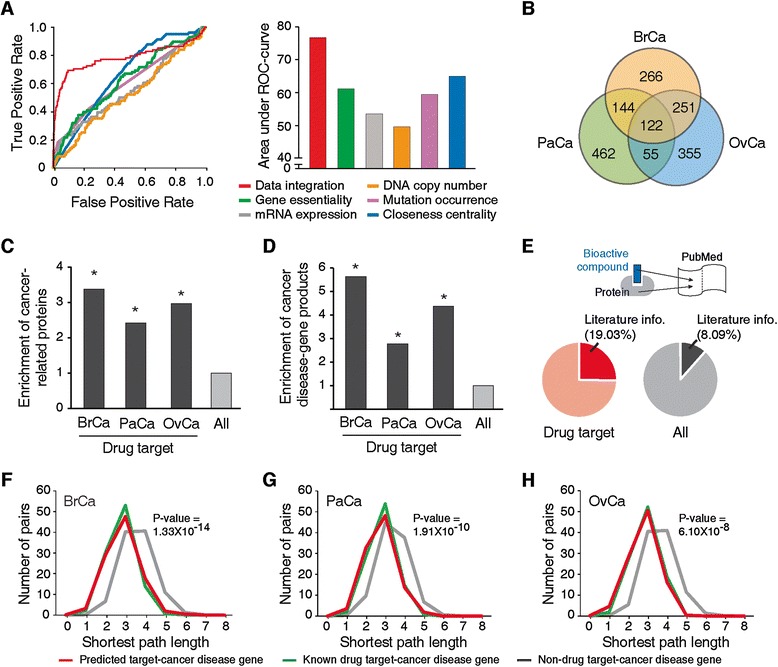
Figure 2.

Performance evaluation of classifier and biological properties of predicted anti-cancer drug targets. (A) Receiver operating characteristic (ROC) curve (left) and area under the ROC curve (AUC; right) of integrated approach and single dataset-based approaches are compared. (B) Venn diagram of predicted drug targets for BrCa, PaCa and OvCa. (C,D) The possibility to find cancer-related proteins (C) and to find cancer disease genes (D) in cancer drug targets (black) are compared with those possibilities of all human proteins (All, gray). (E) Analysis of pre-existing literature dealing with cancer pathogenesis. The applications of bioactive compounds (inhibitors and antagonists) of cancer drug targets (red) and all human proteins (All, gray) are compared. (F-H) Distributions of shortest path lengths of BrCa (F), PaCa (G) and OvCa (H). Shortest path length between predicted cancer drug targets and cancer disease genes (red), between known cancer drug targets and cancer disease genes (green) and between non-drug targets and cancer disease genes (gray) in a PPI network are shown. *P-value < 1.00 × 10⁻⁵.
