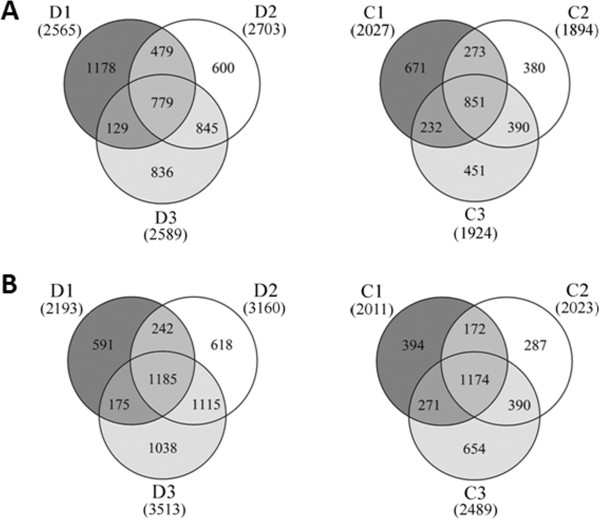
Figure 5.

Venn diagrams showing the numbers of common and specific DEGs at different time points of drought and cold treatments. The up-regulated (A) and down-regulated (B) DEGs (differentially expressed genes) identified at 2, 8 and 24 h after drought (D1, D2 and D3) and cold (C1, C2 and C3) treatments were analyzed. The numbers of common and specific DEGs at different time points were shown in the overlapping and non-overlapping regions, respectively. The total numbers of up- and down-regulated DEGs at each time point were indicated in parentheses.
