Figure 3.

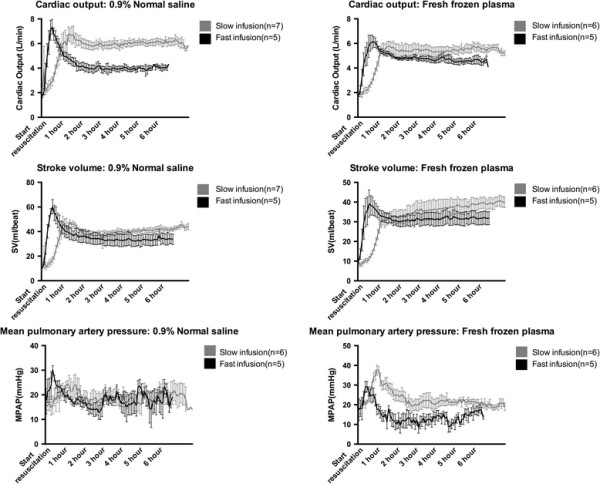
Cardiac output (top), stroke volume (middle) and mean pulmonary artery pressure (bottom) over the course of the 6-hour post resuscitation period. Data presented as means ± standard error of the mean.

Cardiac output (top), stroke volume (middle) and mean pulmonary artery pressure (bottom) over the course of the 6-hour post resuscitation period. Data presented as means ± standard error of the mean.