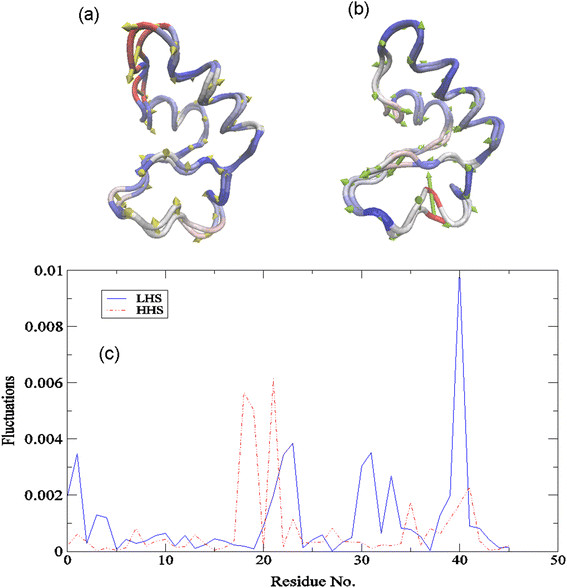
Figure 7.

Largest amplitude PCA mode. Trace representation depicting the Cα- motion of the largest amplitude PCA mode (PC1) of (a) the HHS and (b) the LHS of crambin from the MD simulation. Regions highlighted in red represent more flexible regions of the protein and regions highlighted in blue represent regions with less flexibility. And (c) the corresponding square fluctuations of the PC1 of the LHS (blue solid line) and the HHS (red dot-dash-dotted line) of crambin.
