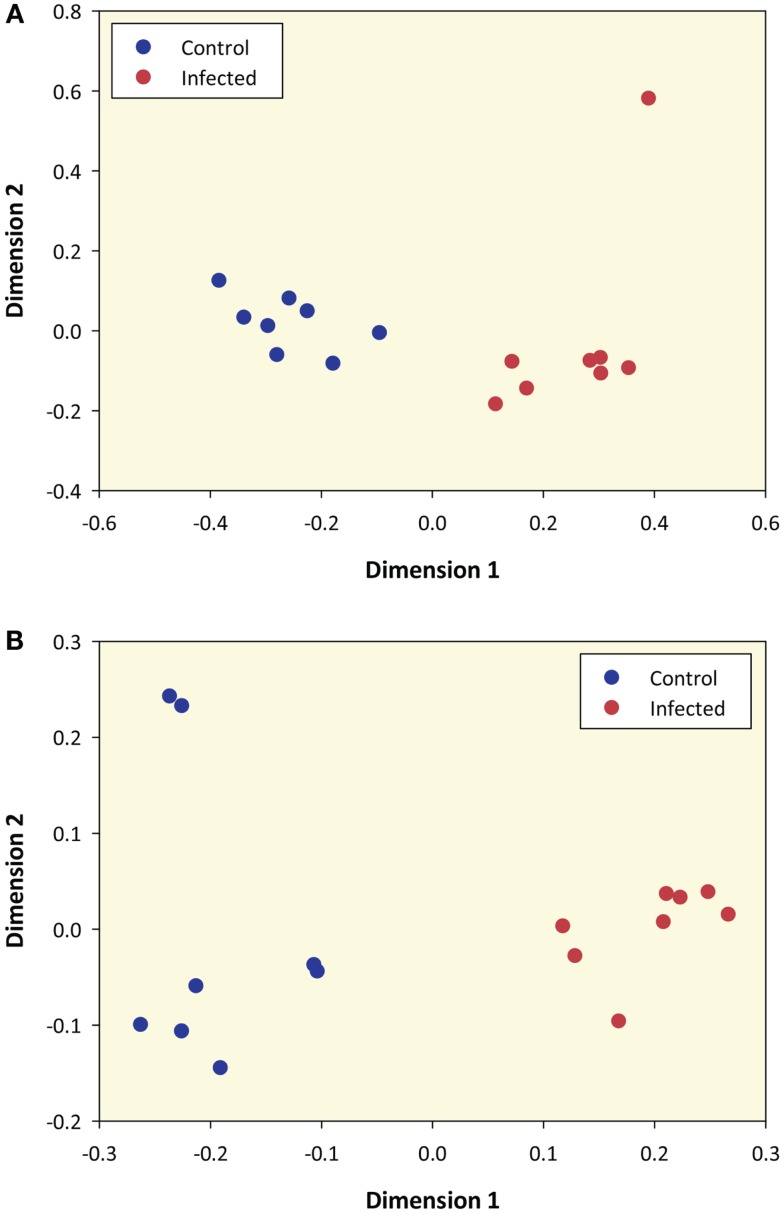
Figure 1.
Multidimensional scaling plot of M. bovis-infected and control samples based on RNA-seq sense data and microarray data. (A) MDS plot of 8 M. bovis-infected and 8 control PBL samples generated from 12,294 genes that passed all data filtering prior to differential gene expression (based on RNA-seq sense data only). (B) MDS plot using data from 5,082 informative microarray probe sets in 8 M. bovis-infected and 8 control PBL samples.

