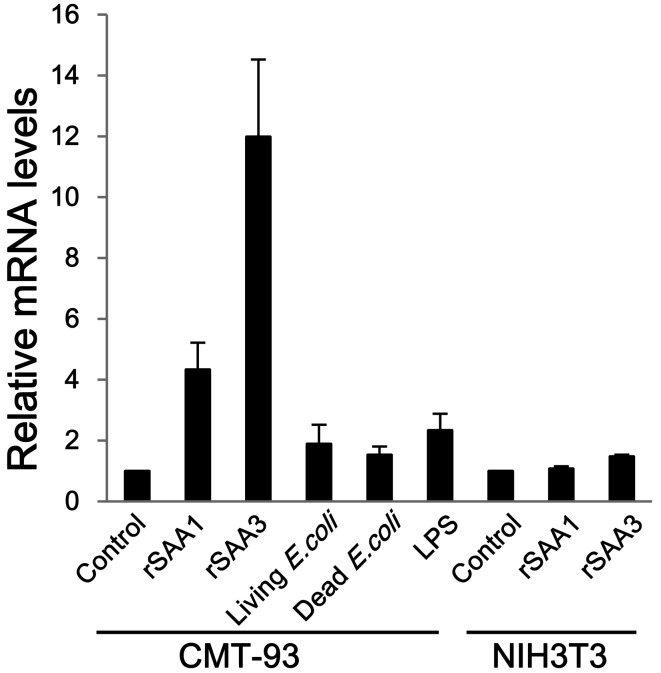
Fig. 3.
Comparison of MUC2 mRNA expression in CMT-93 and NIH3T3 cells. CMT-93 cells were inoculated with rSAA1, rSAA3, living or dead E. coli, or LPS. Murine fibroblast NIH3T3 cells were used as control cells. The relative mRNA expression levels of MUC2 were corrected with GAPDH and then compared with controls. Data are the means of at least 3 observations with standard errors represented by vertical bars.

