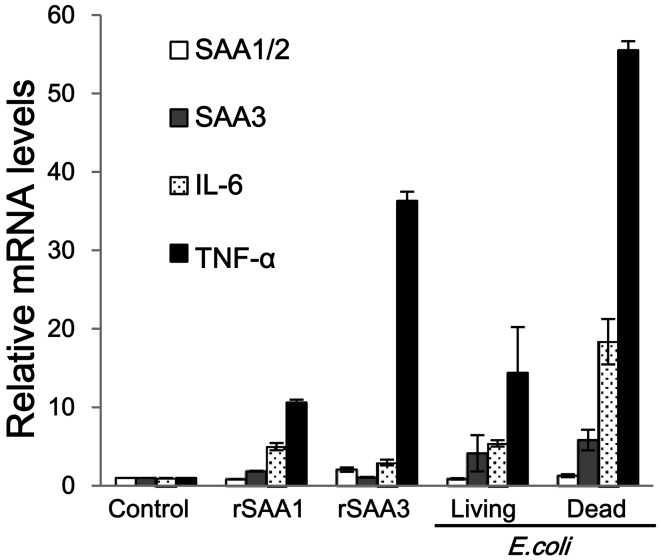
Fig. 4.
Comparison of mRNA expressions of SAAs and cytokines in CMT-93 cells. CMT-93 cells were incubated with rSAA1, rSAA3, or living or dead E. coli for 2 hr at 37°C. mRNA expression levels of SAA1/2, SAA3, IL-1β, IL-6 and TNF-α were measured. IL-1β mRNA expression was not detected. The relative mRNA expression levels of SAA1/2, SAA3, IL-6 and TNF-α were corrected with GAPDH and then compared with controls. Data are the means of at least 3 observations with standard errors represented by vertical bars.

