Figure 1.
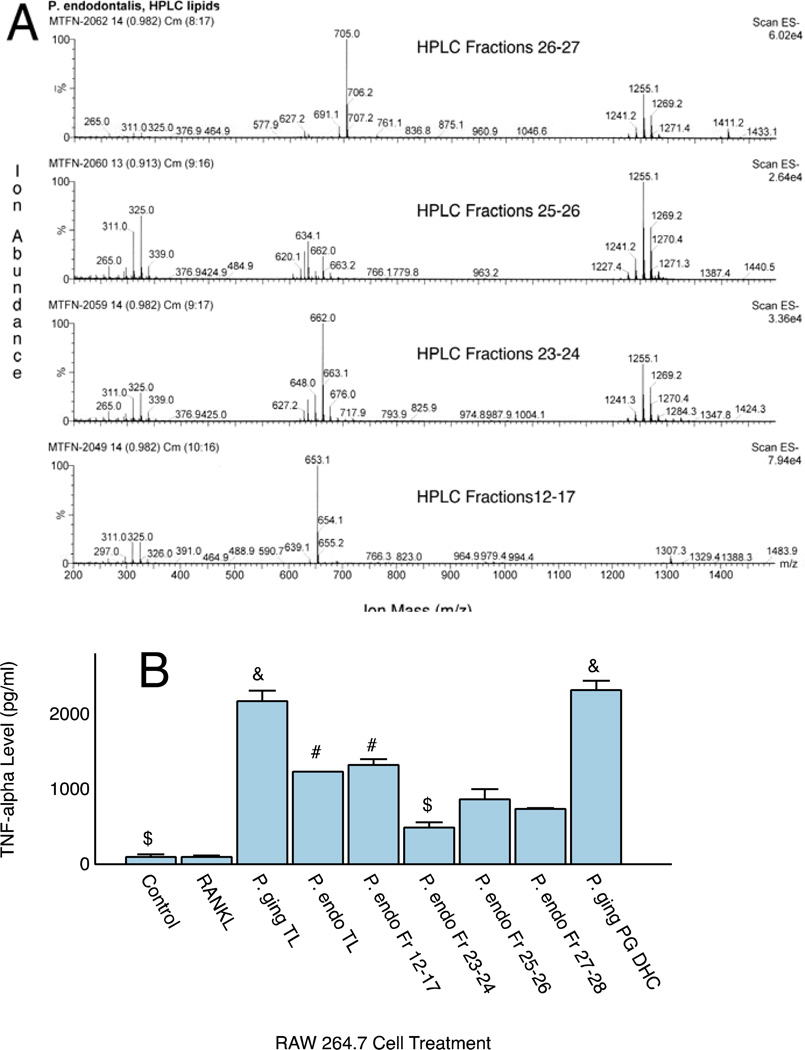
Mass spectra of pooled HPLC fractions of P. endodontalis lipids and TNF-α Secretory Responses. HPLC fractions of the total lipid extract were pooled based on recovery of specific lipid classes as determined by ESI-MS (Figure 1A). Mass spectra of these pooled HPLC fractions were acquired using negative ion mode ESI-MS as described in the Materials and Methods. HPLC Fractions 12–17 contained the recently reported serine lipid class of P. endodontalis (Lipid 654, centered around m/z 653), HPLC Fractions 23–24 contained mostly PEA lipids (m/z 662 and 648, (10)), HPLC Fractions 25–26 contained mostly high mass lipids of unknown structure (centered around m/z 1255) and HPLC Fractions 27–28 contained mostly PE DHC lipids (m/z 705 and 691, (9)). Figure 1B shows the effect of total lipid extracts from P. gingivalis and P. endodontalis and selected lipid fractions on TNF-α secretion from RAW 264.7 cells in culture. Lipids were sonicated in culture medium at 10 µg/ml and cells were treated for 24 hours with the indicated lipid fractions. TNF-α quantitification was performed with a commercially available ELISA as described in the Methods section. Results are expressed as the mean ± SE (n=3). One factor ANOVA revealed significant differences for all lipid preparations versus controls or RANKL treated cultures (p<0.05 by post hoc pairwise comparisons), &P. gingivalis total lipid (TL) was not significantly different from the P. gingivalis PG DHC lipid, #P. endodontalis total lipid was not significantly different from Fractions 12–17, $P. endodontalis pooled Fraction 23–24 was not significantly different from controls. Control and RANKL treated cultures were not significantly different.

