Figure 1.

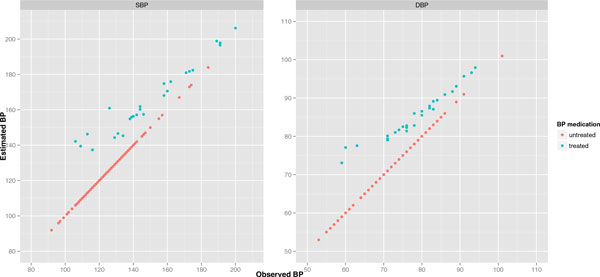
Scatterplots of observed versus adjusted BP for the first examination time, stratified by SBP and DBP. For untreated individuals, adjusted BPs are equal to the observed BPs; consequently, red points fall on the diagonal.

Scatterplots of observed versus adjusted BP for the first examination time, stratified by SBP and DBP. For untreated individuals, adjusted BPs are equal to the observed BPs; consequently, red points fall on the diagonal.