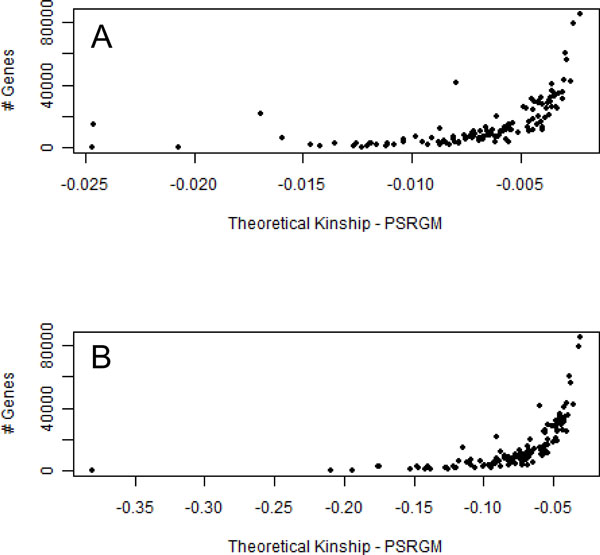
Figure 1.

Deviation of PSGRMs from the expected kinship matrix. Dispersion plot comparing kinship estimators and the number of variants in a gene pathway. Panel A was constructed using the entire set of pairwise comparisons and panel B with only unrelated individuals.
