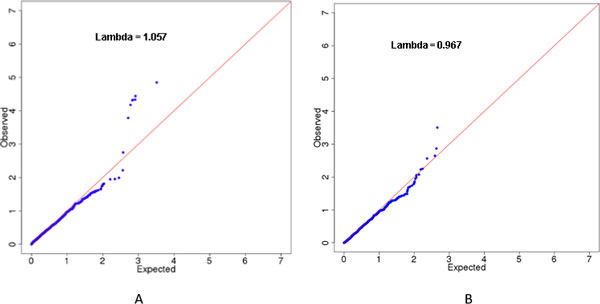
Figure 1.

QQ plot when applied to the first simulation of the GAW18 SBP data. Analysis was performed using the simulated SBP data in GAW18 after controlling for gender, age, age2, antihypertension medicine usage, and smoking. Only chromosome 3 data were used in this analysis. The figures show the QQ plots for GLS-SKAT and FBAT-v1 analyses in the first simulation. (A) QQ plot for the GLS-SKAT analysis. (B) QQ plot for the FBAT-v1 analysis.
