Figure 2.

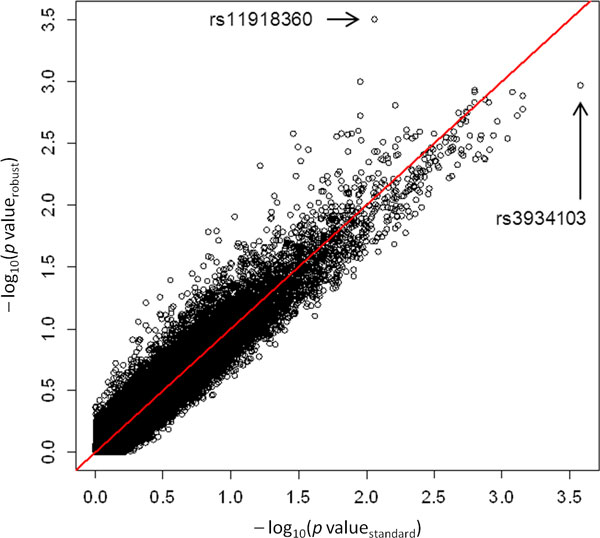
Quantile-quantile plots from the age-genotype standard and robust logistic regression models. The 2 selected SNPs are indicated by their reference SNP ID number.

Quantile-quantile plots from the age-genotype standard and robust logistic regression models. The 2 selected SNPs are indicated by their reference SNP ID number.