
Figure 2.
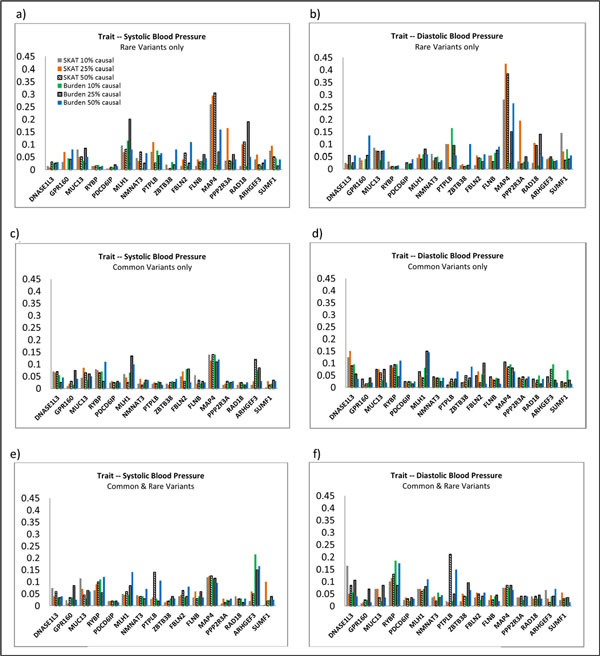
Power of tests under different proportions of causal SNPs (α = 0.05). Plots in the left panels use SBP as a continuous outcome. Plots in the right panels use DBP as a continuous outcome. All 6 plots use the same legend. Plots in the first row use SNPs with MAF ≤0.05. Plots in the second row use SNPs with MAF >0.05. Plots in the third row use both.