Figure 1.

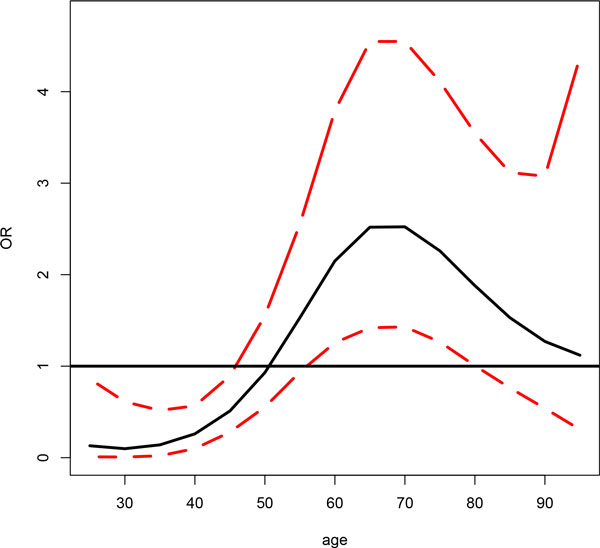
Effect of Haplotype GGTCC (47964587 to 47985074 bp) over the specified age range. The solid line is the odds ratio (OR) of the effects and the 2 red dotted lines are upper and lower bounds of 95% credible intervals.

Effect of Haplotype GGTCC (47964587 to 47985074 bp) over the specified age range. The solid line is the odds ratio (OR) of the effects and the 2 red dotted lines are upper and lower bounds of 95% credible intervals.