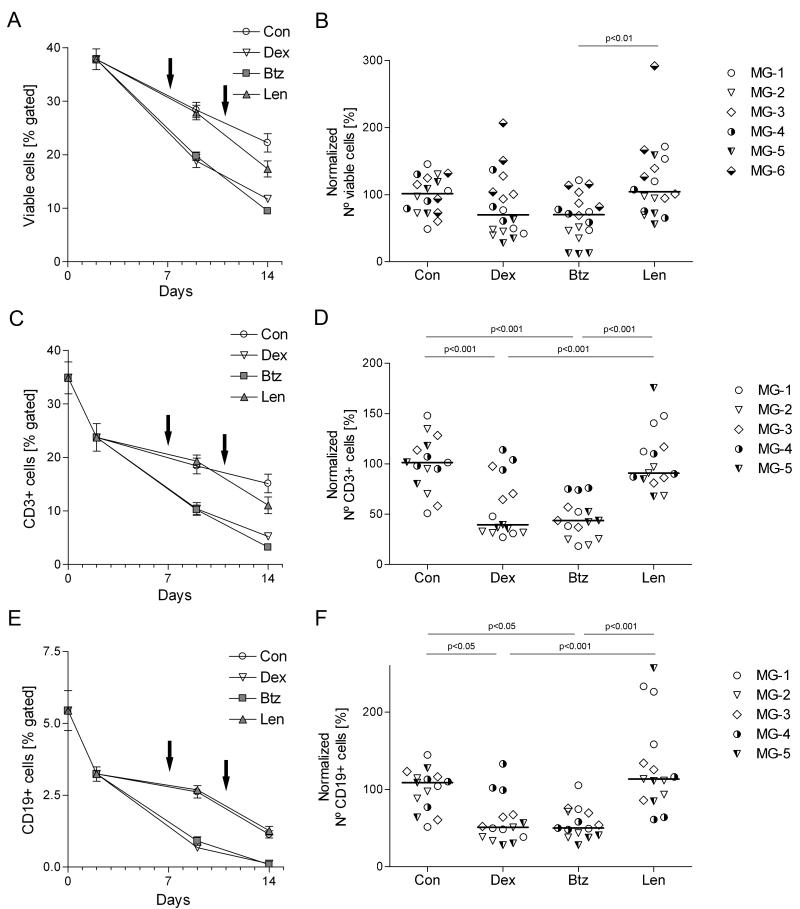
Figure 4.
Quantitative overview of the drug effects on B- and T-lymphocytes. Thymic cells were cultured for 2 weeks and drugs were added on days 7 and 11 (indicated by arrows). Cells were collected and labeled for FACS analysis on days 0, 2, 9 and 14. Samples were gated to exclude cell debris, selected for viable (PI-negative) cells and for either CD3 or CD19. In, A, C and E, each point represents the average of samples from patients MG-1, MG-2 and MG-3 (3 per patient). Error bars correspond to the SEM. Each point in panels B, D and F represents one well (3 per condition) from the indicated patients for day 14; horizontal bars are median values. Results are normalized as for Fig 2B, and absolute cell numbers are shown in Table 2. At least 10,000 total events per sample were recorded; numbers of events analyzed per gate and per patient are given in Supplemental Table S1. One-way ANOVA and Bonferroni post hoc testing were used for statistical analyses.

