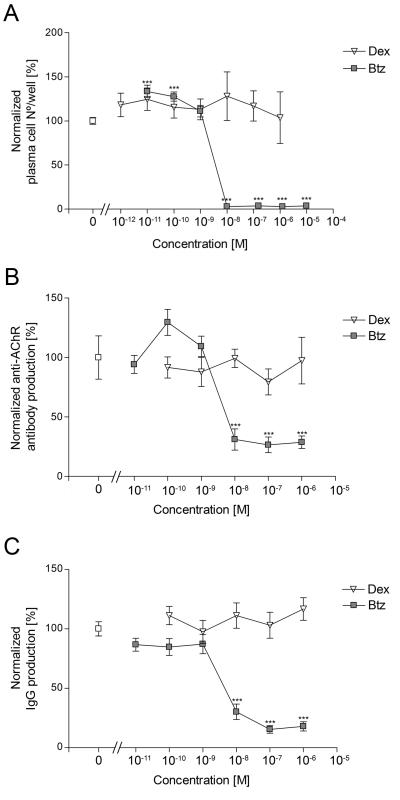
Figure 5.
Dose-response curves for plasma cell numbers (A), AChR Ab production (B) and total IgG secretion (C), after addition of drugs on day 4 and assay on day 7. Thymic cells from patients MG-1 and MG-3 were used in A; cells from MG-4 and MG-5 in B; and cells from MG-1, MG-3, MG-4, MG-5, MG-7 and MG-8 in C. Each point represents the average of the normalized results for all the patients analyzed (at least 3 replicates per patient) and error bars the SEM. One-way ANOVA and Bonferroni post-hoc testing were used for statistical analyses. *** p<0.001, compared with the untreated cultures (white square).

