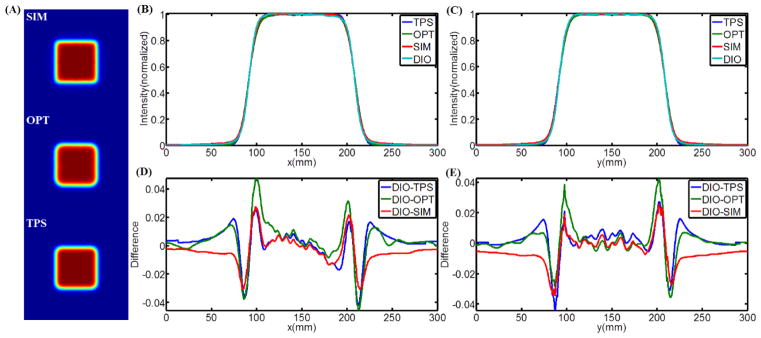
Figure 7.

(A) 2-D superficial dose distribution from Monte Carlo simulation, Čerenkov emission imaging and TPS for 0 incident angle. (B–C) CP and IP superficial dose profiles of the results from Monte Carlo simulation, Čerenkov emission imaging, TPS and water tank diode scanning. (D–E) CP and IP difference between the profiles from water tank diode scanning and other three techniques.
