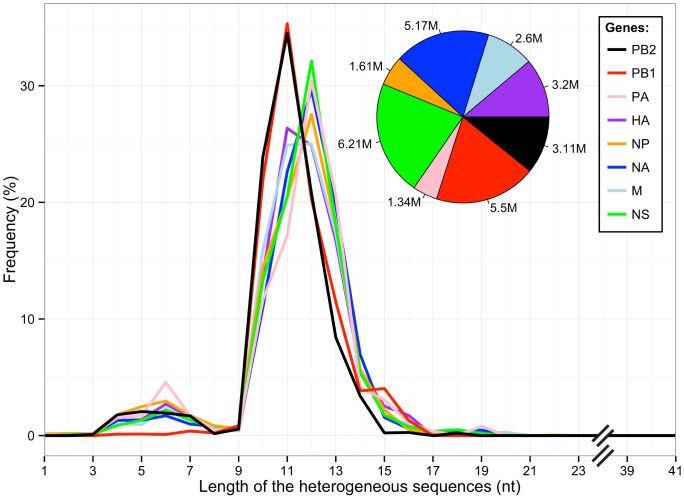
Figure 2. Length distribution of the heterogeneous sequences obtained from infected A549 cells.
All sequences representing each of the eight IAV transcripts isolated from infected A549 cells and located between the ligated RACE primer and position G2 on IAV mRNA are included. Inset: proportion of IAV sequences corresponding to each transcript obtained following high-throughput sequencing.

