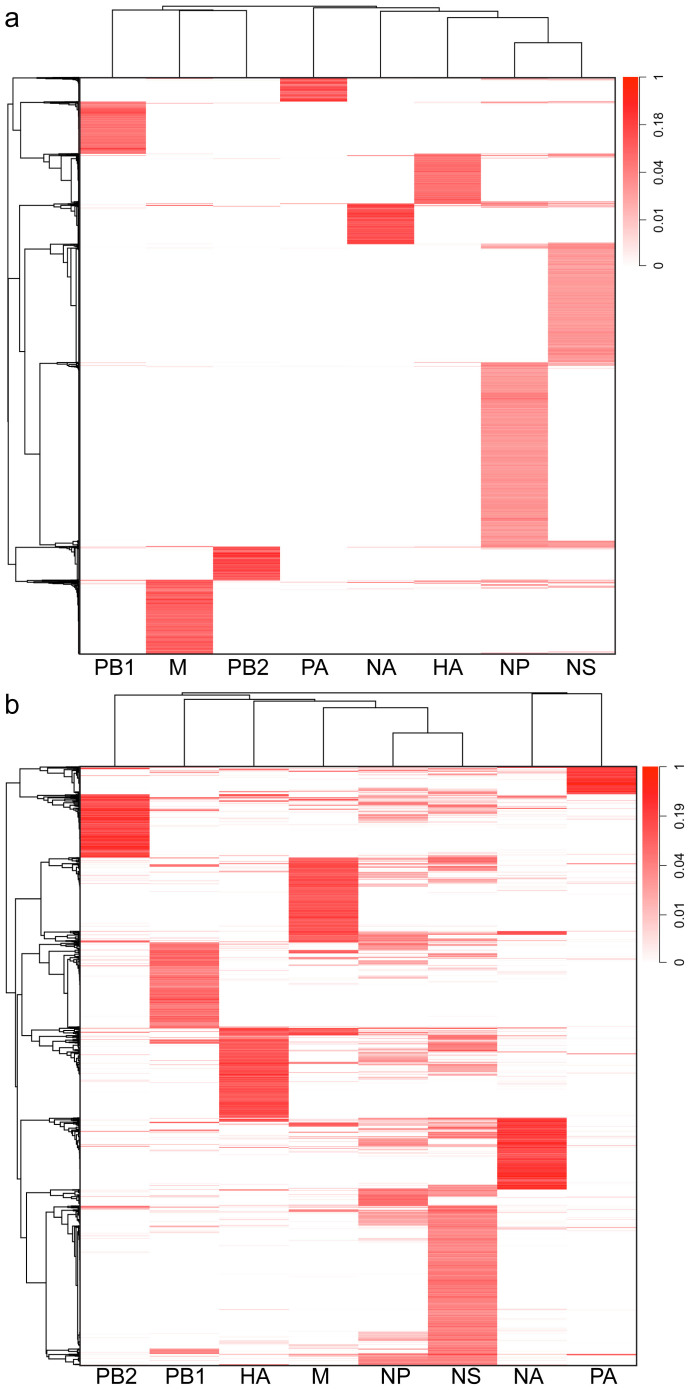
Figure 4. Human sequences and genes used by the eight viral transcripts.
(a) Heatmap representation showing the distribution of the heterogeneous sequences (vertical axis) associated with each IAV transcript. (b) Heatmap representation showing the distribution of the host genes (vertical axis) potentially used by each IAV transcript. The heterogeneous sequences/host genes are hierarchically clustered. Data in each column have been normalized to the maximum value in that column. To simplify the representation, only sequences/genes that appears at least 1000 times were used.

