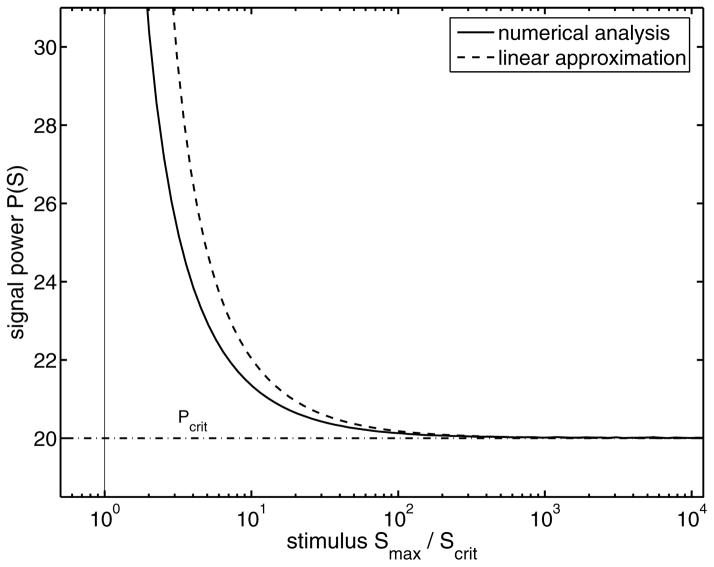
FIG. 11.
Semilogarithmic plot of the signal power as a function of the external stimulus for the nonlinear system (1) (solid line) and for the linear approximation (9) (dashed line). The dash-dotted line is the minimal signal power (13) following from the strong stimuli approximation. The line defines the minimal signal power required to switch the system between the stable states.

