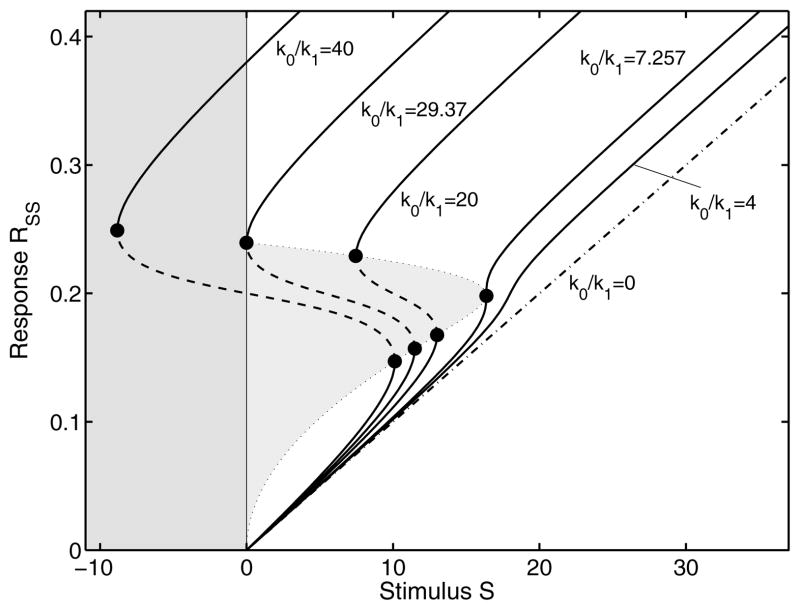
FIG. 3.
Steady state step stimulus response curves for different feedback strengths (k0/k1). The system behavior changes from a one-way switch to a toggle switch and finally to a monostable system. The second curve from the left, separates the toggle-switch from a one-way switch. At Smax = 0 there is a second critical point. The third curve is a typical example for hysteresis. If we further decrease the feedback strength, the critical points coincide and finally disappear. For weak positive feedback the system is monostable and asymptotically approaches the response curve for k0/k1 = 0, representing the step stimulus-response of a linear system. Additionally, we plot the unstable region in gray. In order to represent the complete course of all curves we extend the abscissa to negative stimuli, which is of course physically irrelevant.

