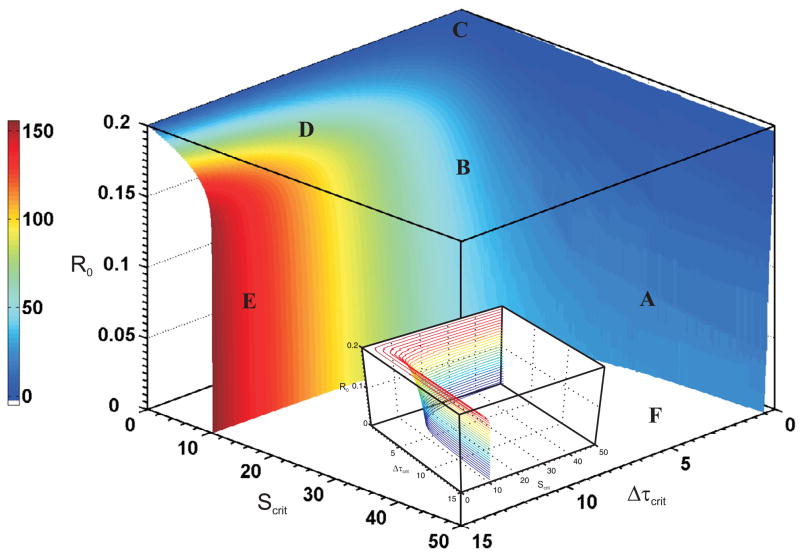
FIG. 8.
Switching surface of the system’s pulse response to an initial condition R0, critical stimulus Scrit and critical pulse duration Δτcrit. Regions A–F represent characteristics of the switching surface. Heatmap color refers to the critical power Pcrit. A contour plot included in the inset indicates further details about the surface.

