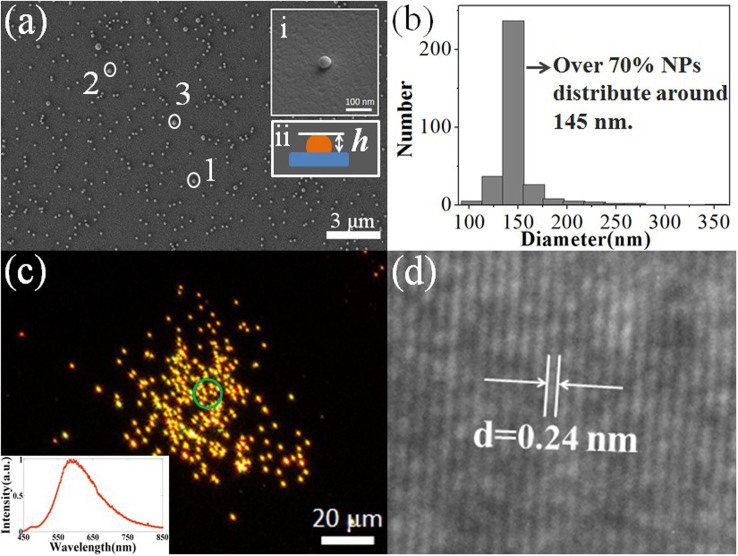
Figure 3. The transferred NPs are studied through dark-field spectroscopy, SEM and TEM.
(a) SEM image of receiver substrate; inset (i) is a 60° oblique viewing of a single transferred NP; inset (ii) is the schematic of a single transferred NP, exhibiting a spherical dome shape; here h represents the height of the NP. (b) Histogram of the transferred NP size distribution. (c) Dark-filed optical microscopy image; inset is the scattering spectrum of the NPs, and the area measured is shown by the green circle. (d) A transferred Au NP under TEM.

